In many projects I work with hydraulic structures. In order to publish the outcomes of my projects I’d like to visualize them dynamically on the web. So here’s an experiment with HTML + Javascript + CSS in generating a weir schematic, based on the weir’s parameters.
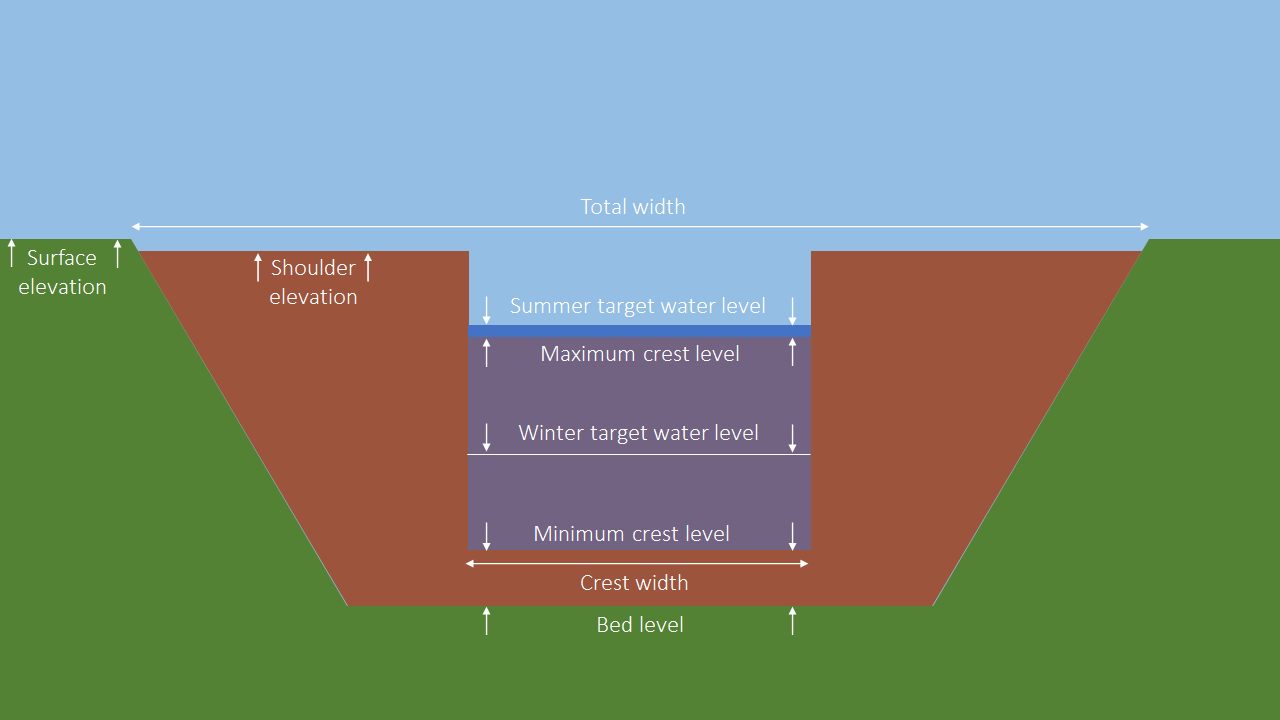
Let’s fire up Powerpoint and draw a first schematic of a rectangular weir:

This type of structure typically contains a crest that can be moved up and down. The following variables are relevant in hydrological/hydraulic studies:
- Crest width
- Minimum crest elevation
- Maximum crest elevation
- Elevation of the structure’s ‘shoulder’
And to put their values into context:
- Surface elevation (m w.r.t. datum)
- Summer target level (m w.r.t. datum)
- Winter target levels (m w.r.t. datum)
- Bed level (m w.r.t. datum)
From web programming I know that the canvas object can be used to create custom drawings in the browser. This will be the way to go for now. Judging from the above image, we can start by simply stacking some rectangles and triangles on top of each other for a first representation.
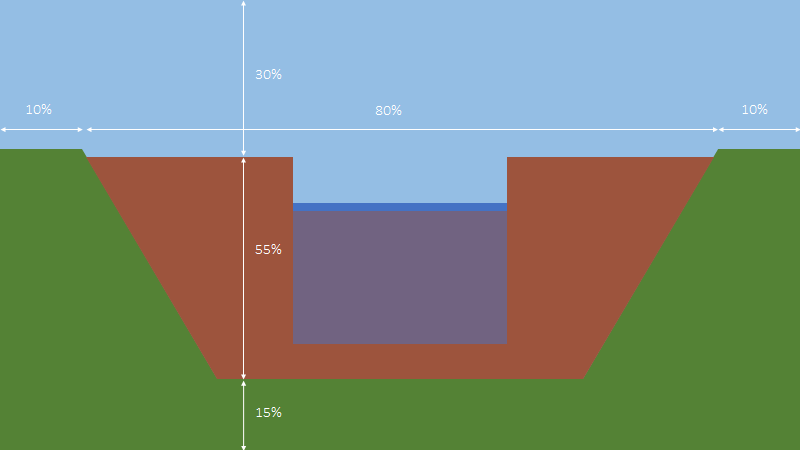
To make every weir fit inside the canvas we’ll need to define a basic division of the plane:
First thing to do now is to establish the relationship between our real-world co-ordinates and their equivalent in pixels on the canvas. Good thing that we have two reference points for both the x-axis and the y-axis:
For the x-axis:
PixelsToShoulderLeftSide= ax * 0 + bx (using the left side of our shoulder as x = 0)
PixelsToShoulderRightSide = ax * TotalWidth + bx
And for the y-axis:
PixelsToShoulder= ay * ShoulderElevation + by
PixelsToBedLevel= ay * BedLevel + by
Creating a rectangle in Javascript requires setting a style and extent for both the fill and the stroke:
let land = canvas.getContext(“2d”);
land.fillStyle = “#70AD47”;
land.fillRect(0,200,800,400);
land.strokeStyle = “#000000”;
land.strokeRect(0,200,800,400);
I’m not going to elaborate on this since all this stuf can be found at https://www.w3schools.com/. Trying out your own code in a sandbox can be done here: https://www.w3schools.com/graphics/tryit.asp?filename=trycanvas_draw. Below I will show the final result.
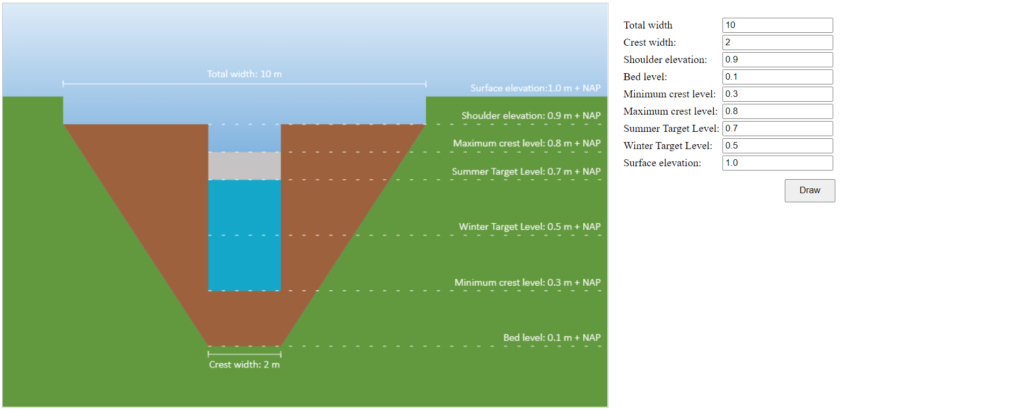
Try it out yourself here (under construction)
My conclusions after this experiment:
- The HTML5 canvas is easy to use and very suitable for drawing schematics.
- Using it in conjunction with Javascript makes it possible to generate them dynamically.
- It still looks rather simplistic. Visual effects (e.g. Watercolour) could help, but effects like these are not easily achieved in Canvas.
- The greatest challenge is yet to come: pinpointing errors in the data.